
One thing I love about teaching is creating anchor charts with my students. I know, it sounds crazy, but I love it. I love the discussions that take place as students share their thinking, and I love seeing the anchor charts evolve as students begin to think more deeply about a story. When we are finished with a topic or a discussion, the anchor charts hang on our classroom walls, evidence of our thinking and of our growth as the year goes on.
Teaching in a remote or hybrid model is hard. Planning takes time, and teachers have to reimagine everything. I was not ready to give up on anchor charts, even in this environment. This fall, my colleague and I discovered Google’s Jamboard. Using Jamboard, teachers create “Jams” for a particular topic. Students can write, add pictures and even sticky notes to the Jam, and their classmates can see the updates in real time. All can work together to move the sticky notes around, creating an electronic anchor chart with a similar look to our in class anchor charts!
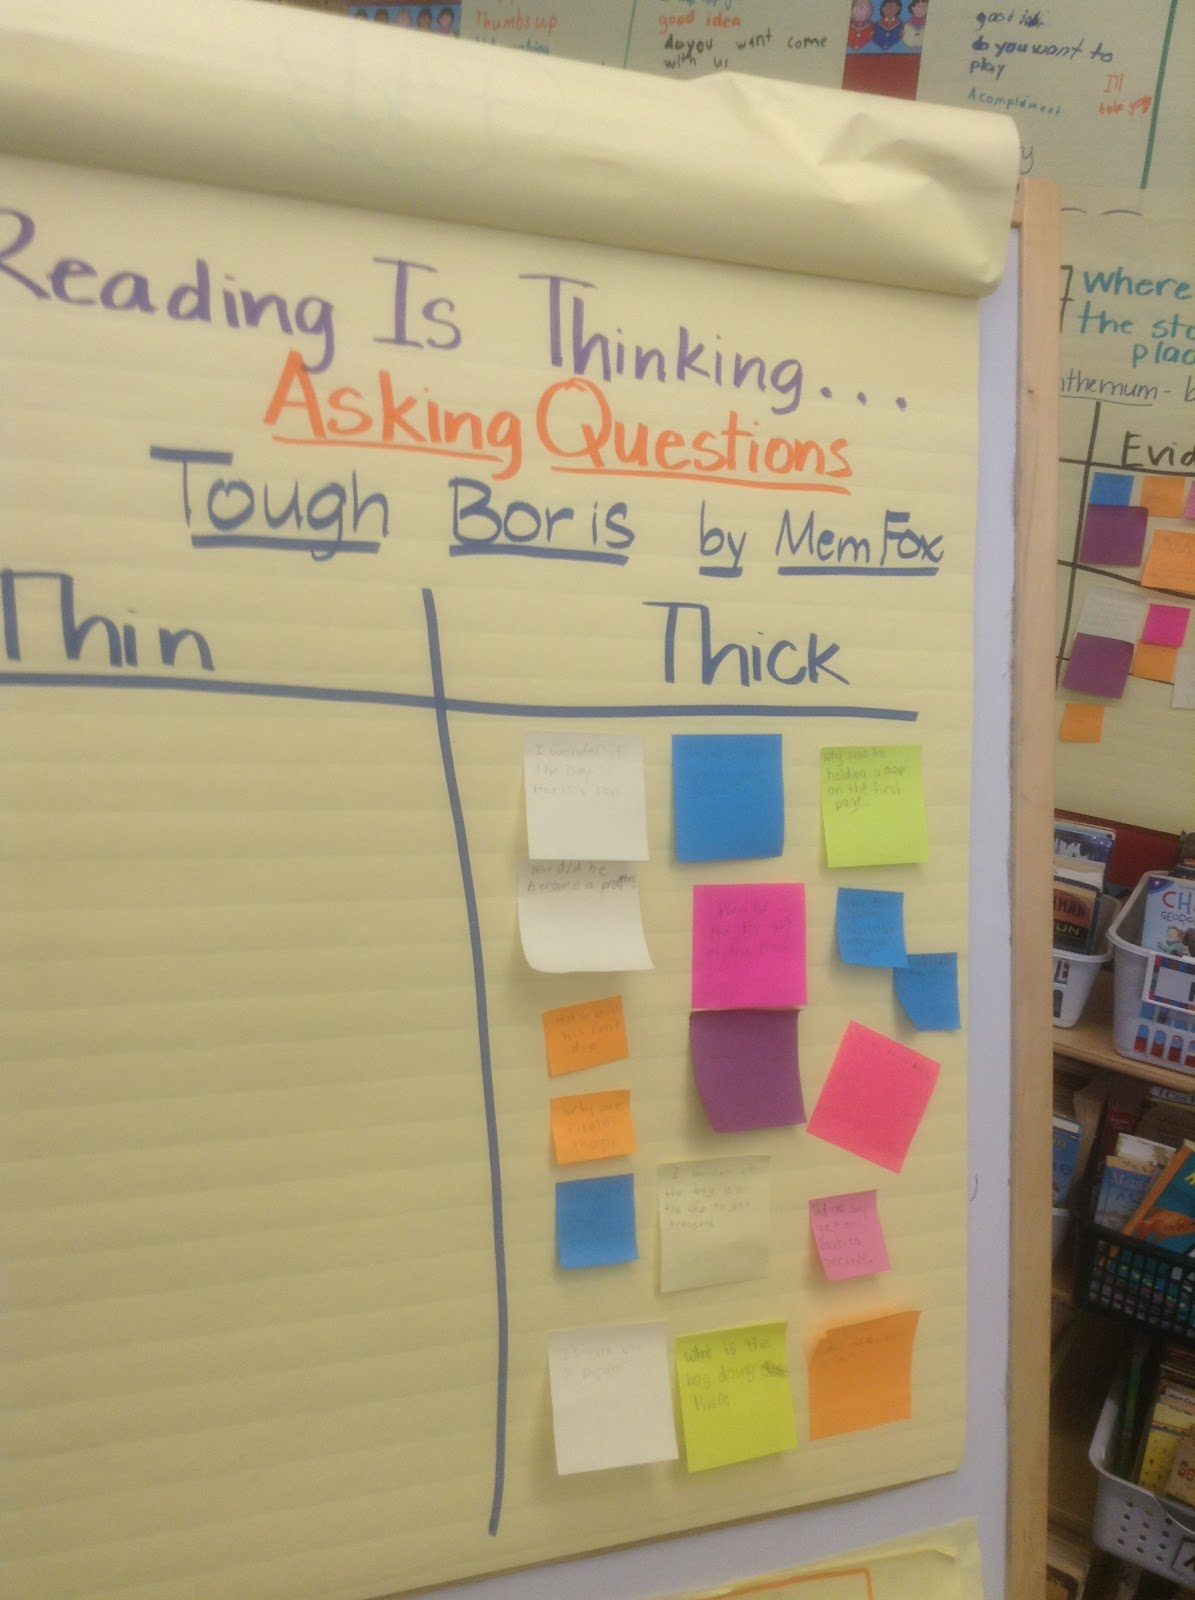
by Mem Fox

Teachers can even create a collection of Jamboards for a particular topic. Ann Williams, TBR Blogger and fourth grade teacher, created this set of Jamboards to use with her Interactive Read Aloud, Mighty Jack by Ben Hatke. These slides are student reflections about different versions of Jack and the Beanstalk from around the world.


If you are interested in trying out Jamboard with your students, it is easy! Check out the video below for some tips.
This is a great post and I’m glad I read it.
PS — We might be long-lost friends — I, too, love making anchor charts with kids…and Tough Boris is one of my favorite books to share with kids.